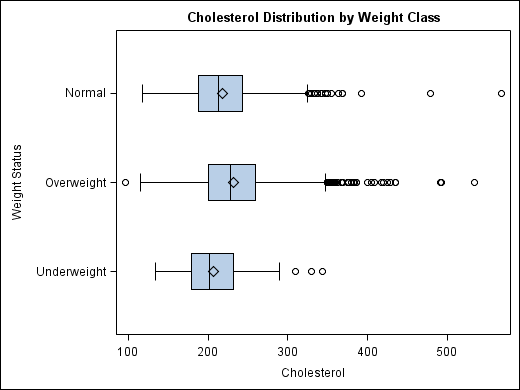
 You may also know these as box and whisker plots, they are depictions of groups of numerical data. Each group is divided into five parts represented by the box and whiskers. The box is divided by the median value, with the top and bottom representing the upper and lower quartiles, the whiskers usually represent the minimum and maximum of a data set.
http://support.sas.com/documentation/cdl/en/grstatproc/61948/HTML/default/a003155605.htm
No comments:
Post a Comment