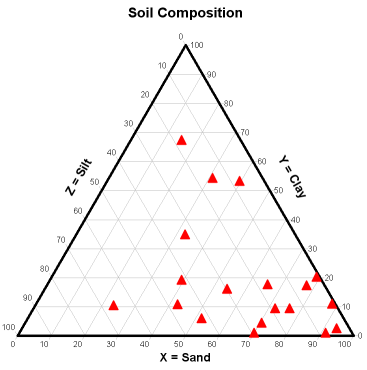
 This is an example of a Triangular plot, a graph of three variables. The Vertex of the triangles are areas of 100% of the variable. These are commonly used when showing soil composition and other geological forms.
http://www.ccp14.ac.uk/ccp/web-mirrors/dplot/triangle_plot.htm
No comments:
Post a Comment